Strait of Hormuz Closure: Iran Blocks Vital Oil Route, 80 Mines Threaten Year-End Reopening
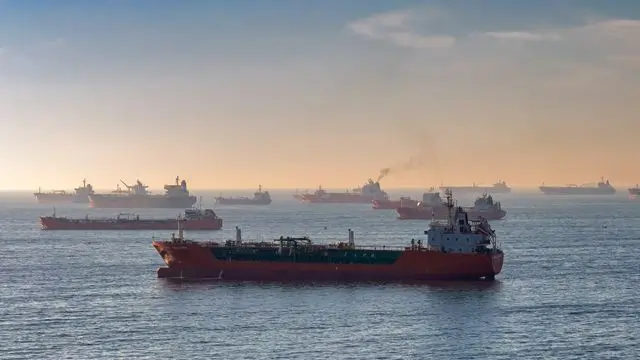
Strait of Hormuz closure June 2026 coverage is not a single-number story. The Maritime Executive, citing Windward, reported 12 detected transits on June 21 after Iran announced another closure. The same report cited a U.S. Central Command statement that 55 merchant ships had transited on June 20 with more than 17 million barrels of oil. Those observations were made at different times and under different counting methods.
The assigned title refers to an Iranian blockage, a mine threat, and a possible year-end reopening. The accessible June 21 report supports a renewed closure announcement and a sharp reduction in observed commercial traffic. It does not establish the title's mine count or prove that normal shipping would stay disrupted until the end of the year. This rewrite keeps the title and slug while separating verified facts from unresolved claims.
The Strait of Hormuz matters because it connects the Persian Gulf with the Gulf of Oman and Arabian Sea. EIA says that oil flows through the strait averaged 20.9 million barrels per day in the first half of 2025, equal to about 20% of global petroleum liquids consumption and one-quarter of global maritime traded oil. That is baseline context, not a June 2026 flow reading.
What You'll Learn
- What the June 20 and June 21 traffic snapshots show.
- Why Iranian statements and U.S. traffic reports differed.
- How EIA baseline flows frame the energy-market risk.
- Which indicators matter more than a single headline.
What Happened on June 20?
The June 21 Maritime Executive report said Iran had once again closed the Strait of Hormuz in response to Israeli attacks in Lebanon. It said the renewed closure followed a recovery in traffic that had begun under a U.S.-Iran memorandum of understanding. The report described the announcement as a change in operating conditions for commercial vessels.
The report also said U.S. forces continued operating in the area to support freedom of navigation. It quoted a U.S. Central Command update that 55 merchant ships transited on June 20 and moved more than 17 million barrels of oil to global markets.
That statement and the later Windward count do not necessarily describe the same population. A military update may count merchant ships and cargo movement over a stated period. A tracking service may count detected transits, classify flags, and separate vessels with visible or dark AIS signals. The difference is material when traffic is changing quickly.
| Date or period | Reported observation | How to read it |
|---|---|---|
| June 20 | U.S. Central Command cited 55 merchant ships | A military statement about ships and cargo |
| June 20 | Windward reference point was 21-plus ships | A tracking comparison before the renewed closure |
| June 21 | Windward detected 12 transits | A lower detected count after the closure announcement |
| June 21 | Neutral and European commercial tonnage was absent in the report | A change in traffic composition, not proof of zero movement |
Why the Traffic Numbers Conflict
Maritime traffic is measured through different systems. AIS transponders broadcast a ship's identity, position, course, and speed, but not every vessel is visible at every moment. Some ships may operate with AIS disabled. A tracking service may also apply its own geographic boundary and definition of a transit.
Military authorities may use radar, satellite, intelligence reports, or operational records that are not identical to public AIS data. A statement about merchant ships may include vessels that a commercial tracker classifies differently. A count of detected transits may include or exclude coastal traffic, vessels turning around, or ships remaining within a defined area.
The right response to conflicting numbers is not to select the more dramatic figure. It is to state the source, date, counting method, and limitation. In this case, the public evidence supports a sharp change in observable traffic after Iran's renewed closure announcement. It does not support treating every reported number as a direct measure of global oil flow.
Why the Strait Matters to Energy Markets
The strait is a chokepoint because large volumes of energy move through a narrow maritime route. EIA's March 3, 2026 analysis says the strait carried an average of 20.9 million barrels per day in the first half of 2025. EIA also says that alternatives can move only part of the oil volumes that normally pass through the route.
A disruption can affect several prices at once. Crude oil reflects expected supply availability. Tanker rates reflect vessel risk, insurance, waiting time, and route changes. Refined products reflect the location of available processing capacity and the ability to move gasoline, diesel, and other fuels to consumers.
What the June 21 Data Shows
The Maritime Executive report says Windward detected 12 transits on June 21. It describes most of them as Iranian-flagged, sanctioned, and inbound ships. The report also says that neutral and European commercial tonnage was absent and that 5 of 8 inbound vessels were operating with AIS disabled.
These details describe traffic quality as well as traffic quantity. A waterway may not be physically empty while still being commercially impaired. If neutral operators avoid a route and the remaining movements are concentrated among linked or sanctioned vessels, energy buyers and insurers may still treat the route as restricted.
The report says the June 21 pattern differed from the limited recovery that had begun under the memorandum. It describes the southern, U.S.-managed transit lane as largely paused. Those observations support a cautious conclusion that the reopening process had stalled in the reported window.
| Traffic feature | Reported June 21 condition | Market meaning |
|---|---|---|
| Transit count | 12 detected transits | Lower observable movement than the prior reference point |
| Vessel mix | Mostly Iranian-flagged, sanctioned, and inbound | Commercial access was not broad-based |
| AIS status | 5 of 8 inbound vessels were dark | Public tracking had an important visibility limit |
| Commercial traffic | Neutral and European tonnage absent in the report | Risk perception may remain high even with some movement |
How the EIA Baseline Frames the Risk
EIA's historical baseline helps explain why the market responds quickly to shipping disruption. In the first half of 2025, EIA estimated 20.9 million barrels per day of oil flows through Hormuz. It described that volume as about 20% of global petroleum liquids consumption and one-quarter of global maritime traded oil.
The baseline should not be copied into a June 2026 daily headline. It describes a different period and a normal-flow estimate. It is useful for scale, not for measuring how many barrels moved during the closure announcement.
EIA also identifies bypass capacity. Saudi Arabia's East-West crude oil pipeline and the UAE's Abu Dhabi pipeline together could provide about 4.7 million barrels per day of capacity to bypass the strait, according to the EIA analysis. Bypass capacity is not the same as immediate available export capacity. It depends on product grades, terminals, storage, contracts, and operating conditions.
Why a Reopening Timeline Is Uncertain
Shipping can resume in stages. A government can announce an opening while shipowners wait for confirmation, insurers reassess risk, and crews review routing instructions. The first vessels to move may not represent the return of ordinary commercial traffic.
The Maritime Executive report describes a recovery that stalled within 24 hours of the renewed closure announcement. That does not produce a reliable year-end reopening forecast. The duration depends on military activity, negotiations, rules for passage, mine or debris assessments, insurance terms, and the willingness of neutral operators to return.
For markets, the uncertainty itself can raise costs. Buyers may pay for alternative cargoes, longer routes, or extra inventory. Sellers may face delays in loading and discharge. The longer those frictions last, the more likely they are to appear in freight rates and regional fuel prices.
What Alternative Routes Can and Cannot Do
Alternative routes can reduce the impact of a chokepoint, but they do not replace it one-for-one. EIA says the Saudi and UAE bypass pipelines together could provide about 4.7 million barrels per day of capacity. That is materially below the historical average flow through Hormuz.
Ships can also travel longer routes around other waterways. A longer route increases sailing time, fuel use, insurance, and vessel demand. It may also require suitable terminals and cargo scheduling. The alternative is therefore a logistical response rather than a quick duplication of the closed route.
Different crude grades and products create another limit. A pipeline or port designed for one stream may not be able to replace every cargo that previously used Hormuz. Market participants must ask not only whether barrels exist but whether the right barrels can reach the right refinery at the right time.
| Response | Potential benefit | Constraint |
|---|---|---|
| Saudi and UAE pipelines | Move some oil around the chokepoint | Combined capacity is below normal Hormuz flow |
| Longer maritime routes | Preserve some cargo movement | Add time, fuel, freight, and insurance cost |
| Inventory drawdown | Cover short-term delivery gaps | Cannot maintain a prolonged shortfall indefinitely |
| Supplier substitution | Shift purchases toward other regions | Depends on available grades, terminals, and contracts |
How India and Asian Buyers May Be Affected
Asian buyers are important to the Hormuz story because much of the route's crude and condensate historically moves toward Asian markets. EIA says China, India, Japan, and South Korea together accounted for 74% of Hormuz crude oil and condensate flows in the first half of 2025.
The effect on any one country depends on its supplier mix, inventory, refinery configuration, shipping contracts, and ability to source from other regions. A country can face higher prices even when it can secure cargoes because the replacement voyage may cost more.
India's exposure should be analyzed with current import and refinery data rather than a fixed legacy percentage. The same applies to China, Japan, and South Korea. Country-level impact is a changing flow problem, not a single permanent ratio.
For additional market context, read our Nikkei and AI market analysis. Our India and AI policy guide covers a separate risk channel for Indian markets.
How to Read Claims About Mines and Security
The legacy article's mine count and year-end reopening claim need a higher evidence bar than a market commentary article can provide. Mine placement, clearance, and navigational safety are operational questions. They require confirmation from maritime security agencies, naval authorities, vessel operators, or specialist intelligence services.
A report that says a mine threat exists is not the same as a verified count of mines in a navigable channel. A threat can change routing decisions even before a physical obstruction is confirmed. The correct wording should preserve that distinction.
Readers should also distinguish a political closure statement from a legally effective closure for every flag state. Operators may follow a warning, a military order, an insurer's instruction, or their own risk assessment. Those decisions can produce low traffic even when the legal status of the waterway remains contested.
Indicators to Watch After the Announcement
The first indicator is traffic composition. A return of neutral and European commercial vessels would show more than a return of any vessel count. The second is AIS visibility. More public signals would improve measurement, but a signal alone would not prove cargo completion or safe passage.
The third indicator is the difference between official statements and independent tracking. A persistent gap would mean that market participants need to assign a wider range of possible outcomes. The fourth is the movement of crude prices, product cracks, tanker rates, and insurance costs together.
The fifth is bypass utilization. If pipelines, alternative ports, and longer routes begin carrying more cargo, the market may absorb part of the disruption. That does not make the route irrelevant. It changes where the cost appears.
| Indicator | Improving signal | Still unresolved |
|---|---|---|
| Traffic composition | Neutral commercial tonnage returns | Whether movement is sustained |
| Tracking quality | More consistent AIS and independent data | Whether all cargoes are visible |
| Energy pricing | Lower crude, freight, and insurance pressure | Whether the move reflects supply or broader markets |
| Alternative routes | More bypass and rerouted cargo | Capacity and grade compatibility |
How Markets Can Misread a Closure Headline
A closure headline can combine a political statement, a shipping observation, and an oil-price expectation. Those are different layers. The political statement may change quickly. The shipping observation may arrive with a reporting delay. The price expectation may include assumptions about inventories and alternative routes.
Readers should therefore use the date, source, and unit for every number. A vessel count is not a barrel count. A historical average is not a current flow. A bypass capacity estimate is not proof that the capacity is available for every cargo.
For related market coverage, read our Nikkei market analysis, our India and AI market guide, and our crypto market analysis.
Conclusion: A Disputed Closure Needs Dated Evidence
The June 2026 Hormuz story contains a verified closure announcement, a sharp change in publicly reported vessel traffic, and a disagreement between tracking data and a U.S. Central Command statement. The Maritime Executive reported 12 Windward-detected transits on June 21 versus 21-plus on June 20. CENTCOM cited 55 merchant ships and more than 17 million barrels on June 20.
EIA's historical baseline explains why the route matters, with 20.9 million barrels per day through Hormuz in the first half of 2025 and about 20% of global petroleum liquids consumption. It does not forecast the duration of the 2026 disruption. A year-end reopening claim and a specific mine count require evidence that was not established in the sources used for this rewrite.
For markets, the next step is to follow traffic quality, official and independent measurements, bypass flows, crude and freight prices, and regional inventory. Those indicators can show whether the closure remains a headline, a short disruption, or a prolonged logistics problem.
Frequently Asked Questions

SK Jabedul Haque
Building India's most trusted finance education platform — simplifying news, schemes and market trends so anyone can understand and invest confidently.
Read full bio


Never miss an update
Get our clearest explainers on schemes, markets and money — read what matters, without the noise.
Explore more articles