Oil Prices Plunge Below $80: U.S.-Iran Deal Reopens Strait of Hormuz
What You’ll Learn
- Why Brent and WTI fell below key price levels
- How the Strait of Hormuz affects global oil supply
- What Goldman Sachs changed in its oil forecast
- Why a diplomatic framework does not equal normal shipping
What Triggered Oil Prices Below $80?
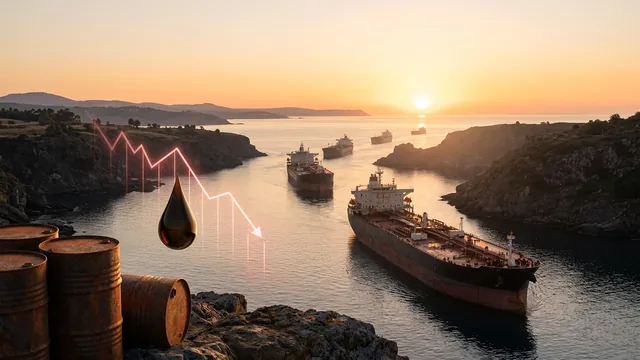
Oil prices fell after the United States and Iran announced an interim framework connected to a ceasefire and the reopening of the Strait of Hormuz. The market read the announcement as a possible reduction in the risk that tankers would remain blocked or delayed through the world’s most important oil chokepoint.
The first response came on June 15. Brent crude fell as much as 5.7% to below $83 per barrel, while West Texas Intermediate briefly fell below $80, according to a World Oil report carrying Bloomberg coverage. Prices had already retreated more than 30% from the highs reached during the conflict.
On June 16, the decline reached a more visible benchmark. CNBC reported that Brent futures fell 5% to close at $78.96 per barrel. West Texas Intermediate lost 5.8% to settle at $76.05. This was the first time Brent had closed below $80 since March, according to CNBC’s dated market report.
The move was therefore not simply a reaction to a lower demand estimate. It was a repricing of the risk premium attached to the Strait of Hormuz, Persian Gulf exports, shipping safety, and the possibility that supply would return faster than traders had expected.
What the Oil Market Actually Did
Brent and WTI are different crude benchmarks. Brent is the main international reference for seaborne oil, while WTI reflects a U.S. benchmark with its own delivery and storage conditions. They often move in the same direction, but the difference between their prices can change when regional supply, transport, storage, or quality conditions shift.
| Benchmark or measure | Reported June move | What the move shows |
|---|---|---|
| Brent on June 15 | Down as much as 5.7% to below $83 | Immediate repricing after the framework announcement |
| WTI on June 15 | Briefly below $80 | U.S. benchmark followed the global risk premium lower |
| Brent on June 16 | Down 5% to $78.96 | Below-$80 close after further supply optimism |
| WTI on June 16 | Down 5.8% to $76.05 | Lower U.S. settlement as traders assessed possible supply recovery |
The daily percentage declines should not be mistaken for the long-run value of crude. They describe a short period in which traders changed the price they were willing to pay for near-term supply and risk. If vessel traffic does not normalize, some of that risk premium can return.
The market also reacted before the full terms of the memorandum had been released. World Oil reported that Washington and Tehran had not yet published the text, while CNBC said the two sides had given conflicting accounts of the deal’s contents. That uncertainty limits what can be concluded from the price move.
Readers comparing this episode with gold and rate-sensitive market coverage should keep the asset differences in mind. Oil reflects physical supply and transport risk. Gold and equities respond to rates, risk appetite, currency conditions, and expected growth as well.
Why the Strait of Hormuz Matters
The Strait of Hormuz connects the Persian Gulf with the Gulf of Oman and the Arabian Sea. The U.S. Energy Information Administration reported that oil flow through the strait averaged 20 million barrels per day in 2024, equal to about 20% of global petroleum liquids consumption.
The EIA also says that few practical alternatives exist for moving much of the region’s oil if the strait is closed. Pipelines can bypass part of the route, but their available capacity is limited and their use can change the normal pattern of exports. A disruption therefore affects both the volume of oil that can move and the time and cost required to move it.
That physical dependence explains why the Strait of Hormuz carries a risk premium even when no tanker is being permanently stopped. Traders price the possibility of delay, higher insurance, crew reluctance, mine-clearing work, and limited alternative routes. The premium can shrink quickly when a credible reopening is announced, but it can also return if implementation stalls.
| Hormuz feature | Verified evidence | Market meaning |
|---|---|---|
| Oil flow | 20 million barrels per day in 2024 | A large volume of global supply depends on the route |
| Share of consumption | About 20% of global petroleum liquids consumption | A disruption can affect prices beyond the region |
| Alternative routes | Available bypass capacity is limited | Rerouting can add time and cost |
| Shipping condition | Safety and operating rules remained uncertain | Announced access is not the same as normal traffic |
The May inflation analysis shows why this chokepoint matters beyond energy traders. A lower oil price can reduce pressure on fuel and transport costs, while a renewed disruption can move in the opposite direction.
What the U.S.-Iran Framework Changed
The framework changed expectations about the path of supply rather than immediately changing the amount of oil in the water. CNBC reported that the provisional agreement would extend the ceasefire for 60 days and reopen the Strait of Hormuz to shipping. The report also said a formal signing ceremony was expected in Geneva.
World Oil described the arrangement as an interim agreement and noted that the memorandum text was not public in the dated coverage. That distinction is important. A framework can create a path toward reopening, but shipping companies still need to understand the rules, security conditions, toll status, insurance treatment, and operational instructions.
The agreement was also linked in CNBC’s reporting to immediate sales of Iranian crude if Iran complied with its commitments. That possibility would add to the supply outlook, but the report made clear that access to the deal’s benefits depended on compliance. The article therefore treats additional Iranian exports as a conditional scenario, not as a guaranteed flow.
The decline in crude prices reflects what traders expected after the announcement. It does not confirm that the framework will be signed on time, that all restrictions will be removed, or that every tanker will resume passage at once.
Why Brent and WTI Moved Differently
Brent and WTI respond to the same broad supply signal but represent different market locations. Brent is closely tied to seaborne international trade. WTI is linked to U.S. production, storage, pipeline flows, and domestic delivery conditions. When a global chokepoint reopens, Brent may react directly to the expected return of seaborne supply, while WTI also reflects U.S. inventories and regional balances.
The June 16 figures illustrate the difference without implying a fixed relationship. Brent settled at $78.96 and WTI settled at $76.05. The gap between the benchmarks is not itself a forecast. It is a snapshot of how market participants priced different locations and delivery conditions on that day.
Benchmark prices also change through the session. Intraday lows, settlement prices, and later electronic trading can show different values. This article uses the dated closing figures from CNBC for June 16 and the intraday description from World Oil for June 15.
Investors should also distinguish crude benchmarks from retail fuel. Gasoline includes refining, distribution, taxes, regional supply, and retailer margins. A crude decline can reduce input costs without producing an immediate or equal decline at the pump.
What Goldman Sachs Forecasts
Goldman Sachs cut its oil forecast after the framework brought forward its expected timeline for Persian Gulf supply recovery. CNBC reported that the bank lowered its Q4 2026 Brent forecast from $90 to $80 and its 2027 Brent forecast from $80 to $75.
The bank also lowered its WTI estimate to $75 for Q4 2026 and $70 for 2027. These are research forecasts, not official prices and not guaranteed outcomes. They depend on assumptions about shipping, production, demand, inventories, sanctions, and the durability of the agreement.
| Goldman Sachs estimate | Earlier view | Revised view |
|---|---|---|
| Brent, Q4 2026 | $90 | $80 |
| Brent, 2027 | $80 | $75 |
| WTI, Q4 2026 | Not stated in the cited comparison | $75 |
| WTI, 2027 | Not stated in the cited comparison | $70 |
Goldman also moved its estimate for Persian Gulf export normalization forward by one month to the end of July. Its report expected oil production to recover fully by October, but that remains a bank scenario rather than a confirmed schedule.
The World Oil June 16 report showed that other analysts were more cautious. It cited concerns that shipping safety and the practical return to pre-conflict flows could take months. The difference between those views is a reminder that oil forecasts are sensitive to operational assumptions.
Why a Forecast Is Not a Price Guarantee
A forecast is a conditional estimate. It describes what an analyst expects if a set of assumptions holds. It does not eliminate the possibility of a different path caused by policy changes, renewed conflict, slower shipping, weaker demand, or a change in production.
Goldman’s revised estimate was based on a faster supply-recovery view. That explains why the forecast moved down after the framework. If the reopening takes longer, the same bank or another bank could revise its view again. If supply returns smoothly while demand weakens, prices could fall further than the cited base case.
Oil markets also respond to inventory conditions. A physical return of crude does not instantly refill inventories that were drawn down during a disruption. The timing of storage rebuilding can influence the price curve even after ships begin moving.
Readers can use the Federal Reserve rate-hold analysis to compare how policy forecasts work in another market. In both cases, the forecast depends on incoming evidence rather than a single headline.
Why Shippers Remained Cautious
Shipping companies did not treat the announcement as an automatic return to normal. CNBC reported that tanker executives welcomed the prospect of an agreement but remained cautious about the reopening. The report quoted the head of a large tanker operator saying that many vessels could wait weeks before resuming transit.
The concerns are practical. Operators need clarity about whether the route is safe, whether mines have been cleared, whether insurance terms have changed, whether tolls will be removed, and whether the agreement will be honored by all sides. A vessel owner may decide that a route is technically open but still commercially unsafe.
World Oil reported that shipping executives and traders wanted more clarity before committing vessels to the route. Spectrum News also reported that waterway conditions and different crew risk tolerances could slow traffic even after an announcement.
This is why the price decline should be described as a reduction in perceived disruption risk rather than proof of restored supply. The physical market needs vessels, crews, ports, pipelines, insurance, and producers to respond together.
What Lower Oil Means for Gasoline and Households
Lower crude can eventually reduce gasoline and diesel costs, but the pass-through is not immediate. Refineries must process crude into fuel, distributors must move the products, and local prices reflect taxes, inventories, competition, and regional conditions.
Spectrum News reported that the national regular gasoline average was $3.99 on June 15, down 9.3 cents over the week and 52.4 cents over the month. The report attributed the data to GasBuddy and said the decline followed the sharp move lower in oil prices.
The same report cautioned that gasoline would not immediately follow every crude move. That is a useful limit for households and investors. A lower benchmark can reduce future input pressure, while retail prices can adjust at a different pace.
| Household channel | Possible effect of lower oil | Why the effect may lag |
|---|---|---|
| Gasoline | Lower wholesale fuel costs can reduce pump prices | Refining, distribution, taxes, and regional supply also matter |
| Transport | Lower fuel costs can reduce operating pressure | Contracts and hedges can delay the effect |
| Food delivery | Lower logistics costs can ease one input | Food prices reflect many other costs |
| Household budgets | Fuel relief can leave more income for other spending | The benefit depends on driving and energy use |
The relationship with inflation is also not one-for-one. Energy can affect headline inflation, transport, and expectations, but the final effect depends on how long prices stay lower and how other categories behave.
What the Deal Means for Inflation and Markets
The oil-price decline can reduce one source of inflation pressure if it persists. Lower fuel costs can help transport firms and households. They can also reduce the cost pressure faced by businesses that use energy directly or indirectly.
Markets may interpret lower oil as positive for growth when it reflects improved supply. The same price decline could signal weaker demand if it happens because the economy is slowing. The reason for the move matters as much as the move itself.
The energy link was visible in the earlier inflation report, where energy was a major source of price pressure. A durable Hormuz reopening could ease that pressure, but the article does not treat one oil session as evidence that inflation is solved.
For equity markets, lower energy can help some consumers and transport users while hurting energy producers. For bonds, the effect depends on how lower energy changes inflation expectations and the Federal Reserve’s policy path. For currencies and emerging markets, the effect depends on imports, exports, and external financing.
What Could Delay a Full Reopening
The first risk is that the memorandum is delayed or interpreted differently by the two governments. World Oil reported that the text was not public in the dated coverage. Without a shared document, market participants have to rely on official statements and operational signals.
The second risk is maritime safety. Mine-clearing, insurance, vessel security, and crew decisions can prevent traffic from returning at the speed implied by a headline. Spectrum News said a senior U.S. official expected traffic to ramp up slowly and return to normal in about 2 weeks, but that was an attributed expectation rather than a completed result.
The third risk is production. Even if ships can pass, oil fields that were shut in may need time to restart. Producers may also choose a gradual restart because of equipment, staffing, storage, or market conditions.
The fourth risk is renewed conflict. A reopening announcement can reduce the risk premium for a time, but a new incident can reverse that move. Traders will therefore watch actual vessel movements and export volumes rather than relying only on political statements.
The gold and geopolitical-risk analysis offers a related example of how markets can move on peace expectations before the underlying conditions are fully settled.
What to Watch Next
The next evidence should come from operations rather than headlines alone. Investors can watch for confirmed vessel transit, shipping-insurance changes, port activity, loading schedules, and official statements about tolls and safety.
Crude production and export data will also matter. A lower price requires more than an announcement if the supply increase is to last. Producers must restart output, terminals must load cargoes, and buyers must be willing to receive the barrels through the route.
Price comparisons should use the same benchmark and time period. Brent’s $78.96 June 16 close cannot be compared directly with a WTI intraday low or a retail gasoline average. Each value answers a different market question.
The valuation coverage is a useful reminder that market interpretation depends on context. Oil prices, bond yields, equity multiples, and household costs can react to the same event in different ways.
The measured conclusion is that oil prices below $80 reflect improved expectations for supply and lower geopolitical risk, not proof that the physical oil system has fully normalized. The next phase will be judged by shipping, production, and the terms of the agreement.
Frequently Asked Questions

SK Jabedul Haque
Building India's most trusted finance education platform — simplifying news, schemes and market trends so anyone can understand and invest confidently.
Read full bio


Never miss an update
Get our clearest explainers on schemes, markets and money — read what matters, without the noise.
Explore more articles