Crypto Fear and Greed Index at 17: Extreme Fear Explained
What You'll Learn
- Why the protected headline's 17 does not match Alternative.me's June 11, 2026 API record
- How Alternative.me and CoinMarketCap calculate different versions of a crypto sentiment score
- What the June 5 Bitcoin move below $60,000 adds to the sentiment discussion
- How to read extreme fear without treating it as a price forecast or buy signal
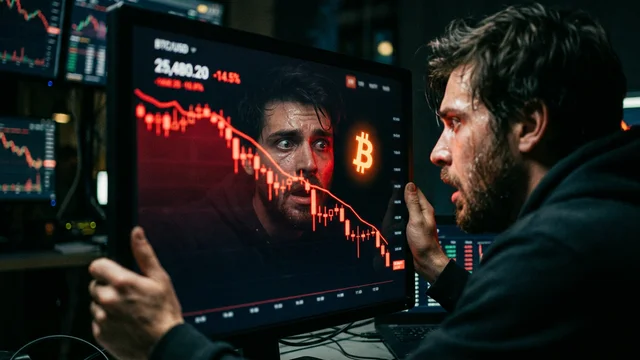
The Crypto Fear and Greed Index is often presented as a quick answer to a difficult question: how worried or optimistic are crypto market participants? That framing is useful only when the reader knows which index is being used, which date the score belongs to, and what the score can actually measure.
Post 858 keeps its original title and slug because the publishing workflow protects both fields. The title says the index was at 17, but a direct check of Alternative.me's public historical API shows a value of 12 for June 11, 2026. A value of 17 appears in that series on June 24. CoinMarketCap has a separate proprietary index, so the two series should not be merged.
The correction changes the article's purpose. It is not a claim that 12 predicts a Bitcoin rebound. It is a source check followed by an explanation of the indicator. Readers can compare this market-sentiment review with the stablecoin settlement analysis and the institutional DeFi funding report, which use different evidence types for infrastructure and capital events.
Why the Title and Date Need Reconciliation
A historical market article must keep the source date attached to every score. A value can change each day, and competing providers can use different inputs, weights, update times, and labels. Repeating a number without its series can make a correct value appear to be evidence for the wrong event.
The official Alternative.me API response used for this review records timestamp 1781136000 for June 11, 2026. That record has value 12 and classification Extreme Fear. The same response records value 17 at timestamp 1782259200, which converts to June 24, 2026. The protected title's 17 is therefore not used as the June 11 Alternative.me fact.
This does not prove that no other provider displayed 17 on June 11. It proves that the Alternative.me record checked for that date displays 12. The correct editorial wording is source-specific: Alternative.me recorded 12 on June 11, while a separate provider may have shown a different reading. The article will not call the headline number a verified June 11 value.
| Item | Verified record | Editorial treatment |
|---|---|---|
| Protected title | Uses 17 | Kept unchanged to protect the title and slug |
| Alternative.me June 11 record | 12, Extreme Fear | Used as the source-corrected historical fact |
| Alternative.me June 24 record | 17, Extreme Fear | Used only to explain the date mismatch |
| CoinMarketCap index | Separate proprietary series | Not merged with Alternative.me |
The distinction also protects readers from hindsight. A score that looks low after a fall can seem like a signal that identified the bottom. It did not. It was a measurement of inputs used by that provider on a particular day.
What the Crypto Fear and Greed Index Measures
Alternative.me describes its product as a daily number that combines emotions and sentiment from several sources into a simple meter for Bitcoin and other large cryptocurrencies. The scale runs from 0 to 100. Zero means Extreme Fear and 100 means Extreme Greed.
The index is not a balance-sheet measure, a valuation model, or a forecast of the next Bitcoin price. It does not establish whether an asset is cheap in relation to cash flow or network use. It condenses market behavior and search or social signals into one reading so that readers can compare the current mood with prior readings in the same series.
Alternative.me says the current index is Bitcoin-focused. That matters because a Bitcoin sentiment score may not describe every altcoin, stablecoin, or decentralized finance token. A broad market headline can still use the score as context, but it should not imply that the number represents every digital asset equally.
The official Alternative.me index page provides historical values, an over-time chart, and a public API. Those tools make it possible to check the date and classification instead of relying on a recycled screenshot or an undated social post.
Alternative.me and CoinMarketCap Use Different Series
CoinMarketCap also publishes a Crypto Fear and Greed Index, but its page calls the product proprietary and describes a different calculation. Its stated components include price momentum, volatility, the derivatives market, market composition, and proprietary data such as social trend searches and user engagement.
Alternative.me describes volatility, market momentum and volume, social media, surveys that are currently paused, dominance, and trends. The site assigns weights of 25% to volatility, 25% to momentum and volume, 15% to social media, 15% to surveys, 10% to dominance, and 10% to trends. These details explain why two providers can show different scores at nearly the same time.
Readers should record the provider name, observation date, timezone when available, score, and classification. The CoinMarketCap index page also offers historical data through its API. A CMC value should be labeled CMC, while an Alternative.me value should be labeled Alternative.me.
| Alternative.me component | Stated weight | What it captures |
|---|---|---|
| Volatility | 25% | Bitcoin volatility and drawdowns against 30-day and 90-day averages |
| Market momentum and volume | 25% | Recent volume and momentum relative to moving averages |
| Social media | 15% | Public interactions and interest signals |
| Surveys | 15%, currently paused | Weekly polling input described by the provider |
| Dominance | 10% | Bitcoin share of the total crypto market |
| Trends | 10% | Bitcoin-related Google search changes |
The Verified June 11 Score Was 12
The central correction is simple. Alternative.me's public historical API records 12 and the classification Extreme Fear on June 11, 2026. The API response includes a Unix timestamp that converts to that date. The record is a direct source check, not an inference from the article's original paragraph.
The word extreme describes the provider's classification band. It does not mean that every market participant was panicking or that every token was oversold. It also does not provide a fair-value estimate. A low score can accompany forced selling, thin liquidity, macro uncertainty, derivatives positioning, or a change in search and social behavior.
The score should therefore be written with attribution. A precise sentence is: Alternative.me's June 11 record showed 12, classified as Extreme Fear. An imprecise sentence would be: the crypto market was at 17 and ready to recover. The second statement combines a mismatched score with an unsupported forecast.
The live Alternative.me page can change. During the August 20, 2026 browser check, it showed 62 for now, 46 for yesterday, 29 for last week, and 25 for last month. Those dynamic values are not used to rewrite the June event. Historical reporting needs a fixed record or a dated capture.
Bitcoin’s June 5 Move Below $60,000
The sentiment story also has a dated market event. A Yahoo and TheStreet report published on June 5, 2026 said Bitcoin fell below $60,000 for the first time in 20 months. It reported an intraday low of $59,743 and a price of $60,782 at the time of writing.
The report said the previous sub-$60,000 trade was in October 2024. It also linked the selloff to a surprise disclosure from Strategy about a partial Bitcoin sale and described the move as pressure on already fragile crypto sentiment. That wording is useful context, but it does not prove that the sale alone determined the index score on June 11.
Price levels are observations from a market. They are not explanations by themselves. A proper analysis records the date, source, quote convention, and whether the number is a low, a closing price, or a price observed at publication. The article uses $59,743 as the reported low and $60,782 as the contemporaneous price, not as a current quote.
The June 5 market report is the accessible source for this context. A separate Reuters page was discovered for the same date, but its browser view required JavaScript and did not expose readable article text in the research session.
What the 20-Month Comparison Shows
Calling the move the first sub-$60,000 trade in 20 months gives the reader a time comparison. It does not say how far Bitcoin could fall, whether support will hold, or whether the comparison has predictive power. Historical distance can explain why a number attracts attention without turning it into a price target.
The June 5 report also said the prior sub-$60,000 trade was in October 2024. That is a historical marker. It should not be expanded into a claim that the market repeated the same cycle or that a future rally will follow the earlier path.
Short-term crypto prices are affected by trading volume, derivatives, liquidations, fund flows, macro data, policy expectations, and company-specific disclosures. A sentiment index can summarize some market inputs, but it cannot isolate the contribution of each event. The safest wording is that the index and Bitcoin price moved during the same period, not that one caused the other.
Readers following Bitcoin infrastructure can compare this analysis with the crypto index futures report. A futures launch is a market-structure event, while a fear reading is a sentiment observation. They should not be scored as if they were the same type of evidence.
ETF Flows and Strategy’s Partial Sale
The June 5 Yahoo and TheStreet report said U.S. spot Bitcoin ETF net outflows were $2.43 billion in May and another $1.40 billion in June by the time of publication. It also said Strategy announced on June 1 that it sold 32 BTC for approximately $2.5 million during May 26 to May 31.
The same report said Strategy’s holdings fell to 843,706 BTC. These figures describe the report’s account of fund flows and a corporate transaction. They do not establish the total reason for the market decline, and they do not prove that ETF flows predict the next index reading.
Market reports often place flows, corporate actions, and sentiment next to one another because they happened in the same period. Readers should still ask which fact is measured, which is attributed, and which is an interpretation. A flow number is not the same as the total crypto market-cap change, and a corporate sale is not the same as forced selling by the whole market.
The institutional crypto markets report provides a related example of why adoption, fund flows, and prices need separate labels. This article follows the same separation for the June sentiment event.
Why Extreme Fear Is Not a Buy Signal
Alternative.me says extreme fear can be a sign that investors are too worried and could be a buying opportunity. CoinMarketCap similarly presents low readings as a possible sign that fear is driving prices down. Those statements explain how the providers frame their tools. They are not personalized financial advice and they do not guarantee a recovery.
A low score can remain low while prices continue to fall. It can also rise while a market remains below a prior high. Treating every extreme-fear reading as a buy signal ignores position size, liquidity, time horizon, tax status, and the possibility of permanent loss.
The U.S. Securities and Exchange Commission warns investors to be cautious about crypto-asset scams and promises of high or guaranteed returns. The SEC investor alert is general investor-protection guidance, not a finding about Bitcoin or either index provider. It supports the editorial rule that a sentiment score must not be presented as a guaranteed entry point.
Readers can use a score as one descriptive input alongside verified price data, fund-flow data, liquidity conditions, and their own risk limits. That is different from using 12 or 17 as an instruction to buy or sell.
Reading Historical Index Values Without Hindsight
Historical analysis should preserve the original observation rather than update it with today's live widget. Start with the provider and exact date. Then record the value, classification, update time, and whether the provider changed its methodology. Only after that should the reader compare the score with price, flows, and news.
Alternative.me's page describes comparisons with the prior 30-day and 90-day averages for volatility, drawdowns, momentum, and volume. This means the score reflects changes relative to a moving window. A score of 12 in June cannot be read as if it were calculated against a fixed benchmark from an earlier market cycle.
Search interest is another separate signal. Google Trends gave the query Crypto Fear and Greed Index a relative value of 100 on June 5, 89 on June 4, 87 on June 2, 85 on June 3, 80 on June 6, and 45 on June 11. These values show relative search attention in that Trends series, not the market's fear score, Bitcoin's return, or a forecast.
Readers should be wary of charts that combine a sentiment line with a price line but omit provider names and date alignment. A visual correlation may be interesting, but it does not establish a trading rule.
Search Interest Versus Market Sentiment
Autocomplete searches for today, live, chart, historical data, meaning, and Alternative.me show that readers want both current values and explanations. That demand is not itself proof that the market was more fearful. Search interest responds to headlines, volatility, social discussion, and curiosity.
Google Trends is normalized within the selected query and time range. A value of 100 means the highest relative interest in that series, not 100% of the population and not the maximum possible fear. The June 5 peak therefore shows attention relative to the selected period. It should not be described as a second sentiment index.
CoinMarketCap, Alternative.me, Google Trends, and market-price feeds answer different questions. Alternative.me provides a sentiment score with its own methodology. CoinMarketCap provides a separate proprietary score. Trends measures relative search interest. A price feed reports transactions. The article keeps these four evidence types separate.
Readers looking at how technology claims should be checked can compare the AI agent account analysis. Product claims, user interest, and realized usage also require separate source labels. The same principle applies to market indicators.
A Practical Verification Checklist
Before repeating a fear score, open the provider page and check the series name. Next, check the date and timezone. Then look for the classification and the historical record. If another website displays a different number, do not choose the more dramatic one. Identify whether it is a different provider, a different update time, or a different date.
| Check | Question | Why it matters |
|---|---|---|
| Provider | Is the number from Alternative.me, CoinMarketCap, or another series? | Different methodologies can produce different scores |
| Date | Does the timestamp match June 11, 2026 or another day? | Daily values change and the protected title uses a mismatched 17 |
| Classification | Does the source call the value Fear or Extreme Fear? | The label belongs to the provider's own bands |
| Market context | Is Bitcoin price information dated and sourced? | A live quote cannot prove a historical event |
| Interpretation | Is the article making a forecast or a buy recommendation? | A sentiment meter is not a guaranteed outcome |
For a price move, record whether the figure is a low, close, or observed quote. For a fund-flow claim, record the period and whether the source reports net inflows or outflows. For a corporate transaction, record the announcement date and transaction window. These details prevent a single large number from carrying an unsupported conclusion.
The AlphaPepe presale review applies the same approach to project-reported token figures and unconfirmed exchange claims. Source, date, and attribution determine what a number can support.
What to Monitor in the Next Market Update
The next update should begin with the same series used in this correction. Check Alternative.me's historical API for the date under review, then compare it with CoinMarketCap only if the provider name is stated. Keep the score, classification, and update time together.
A durable source log should preserve the API response, the provider page, and the market report used for context. It should also record when a live page was checked and whether the value was later revised. That record lets a future update explain a change instead of silently replacing the historical number. It also prevents a search result, screenshot, or social post from becoming the only evidence for a sensitive market claim.
For Bitcoin context, monitor the price range, ETF flows, derivatives positioning, liquidity, and corporate disclosures as separate observations. A later score above 20 would not by itself prove that the selloff had ended. A later score below 20 would not by itself prove that a collapse was imminent.
Google Trends can show whether interest rises around a headline, but it cannot establish investor intent or future returns. A recovery narrative should therefore wait for a documented change in price, flows, market breadth, and liquidity rather than rely on one fear score.
The final conclusion is narrow. The official Alternative.me record checked for June 11, 2026 was 12 and Extreme Fear. Bitcoin had traded below $60,000 on June 5, with a reported low of $59,743. Those facts describe a stressed period. They do not forecast the next Bitcoin move, validate the protected title's 17 as a June 11 Alternative.me value, or turn extreme fear into a buy instruction.
| Evidence type | Verified June detail | Proper use |
|---|---|---|
| Alternative.me | 12 on June 11, 2026, Extreme Fear | Describe the historical sentiment record |
| Alternative.me | 17 on June 24, 2026, Extreme Fear | Explain the protected title mismatch |
| Yahoo and TheStreet | $59,743 low and $60,782 observed price on June 5 | Provide dated Bitcoin market context |
| Google Trends | 100 relative interest on June 5 and 45 on June 11 | Describe search attention, not fear or returns |
Frequently Asked Questions

SK Jabedul Haque
Building India's most trusted finance education platform — simplifying news, schemes and market trends so anyone can understand and invest confidently.
Read full bio


Never miss an update
Get our clearest explainers on schemes, markets and money — read what matters, without the noise.
Explore more articles