
By SK Jabedul Haque | Published on CurrentAffair.Today | Markets
Why Most Beginners Fear the Option Chain
If you trade options but freeze when you open the Option Chain table, you are not alone. Most beginners either get overwhelmed by the numbers or get lost in terms like Delta, Gamma, Theta and IV. The truth is — you only need to understand 5 things to read the Option Chain well enough to identify today's Support and Resistance levels in under 5 minutes.
Think of the Option Chain as a restaurant menu board. It shows you which dish (strike price) has been ordered the most, how many buyers are on the bullish side, and where the bearish crowd is drawing the line.
What is an Option Chain?
An Option Chain is a table that displays all available Call and Put options for a particular index (like Nifty or Bank Nifty) or stock, arranged by strike price.
| Element | What It Means |
|---|---|
| Each Row | One Strike Price (e.g. ₹22,500, ₹22,600, ₹22,700…) |
| Left Side — CALLS | Bullish bets — traders expecting the market to go UP |
| Right Side — PUTS | Bearish bets — traders expecting the market to go DOWN |
| 5️⃣ OI (Open Interest) | Total number of live contracts at that strike — the most important column for beginners |
The Only 5 Things a Beginner Needs to Know
1. Strike Price
The price level at which the option contract is set. For Nifty, these appear in steps: 22,500 / 22,600 / 22,700 and so on.
2. Calls (Left Side) = Bulls
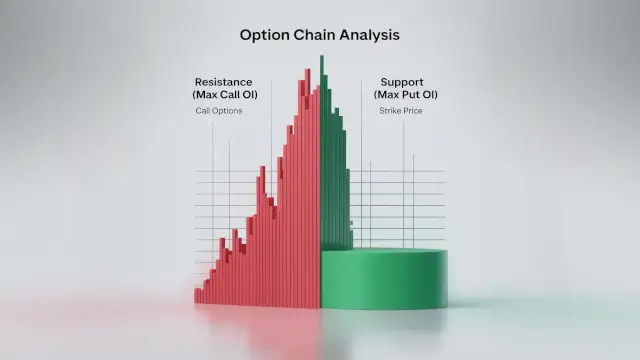
Call buyers believe the market will go higher. The strike price with the highest Call OI becomes the Resistance — the level the market is likely to struggle to break above.
3. Puts (Right Side) = Bears
Put buyers believe the market will go lower. The strike price with the highest Put OI becomes the Support — the level the market is likely to bounce from.
4. ATM, ITM, OTM
| Term | Meaning | Focus Level |
|---|---|---|
| ATM (At The Money) | Strike price closest to the current market price | Highest priority — most active zone |
| ITM (In The Money) | Strike already in a profitable position | Moderate |
| OTM (Out of The Money) | Strike not yet at the market price | Lower priority for intraday |
5. OI (Open Interest) — The Most Powerful Number
OI tells you how many traders currently have live positions at that strike price. The higher the OI, the stronger that level. Start by ignoring Volume, LTP, and IV — focus only on OI.
Step-by-Step: Find Support and Resistance in 5 Minutes
Step 1: Find the Support (Where will the market hold?)
- Go to the PUT side (right column) of the Option Chain
- Look at the OI column — find the strike price with the highest OI
- Example: If ₹22,500 Put has OI = 5,00,000 — that is your Support = 22,500
Why? Hundreds of thousands of traders have placed bets expecting the market to stay above 22,500. The market will face strong buying pressure at this level.
Step 2: Find the Resistance (Where will the market cap out?)
- Go to the CALL side (left column) of the Option Chain
- Look at the OI column — find the strike price with the highest OI
- Example: If ₹23,000 Call has OI = 4,80,000 — that is your Resistance = 23,000
Why? A large number of traders have placed bets expecting the market to stay below 23,000. Sellers will be active at this level.
Step 3: Identify Today's Trading Range
The two numbers you have found define your expected range for the day:
Range = 22,500 (Support) – 23,000 (Resistance)
The market is most likely to trade between these levels unless a strong breakout or breakdown occurs. This gives you a clear framework for intraday decisions.
Pro Tip: This approach is most accurate when the current market price is near ATM. The closer the price is to the middle of the range, the more reliable the Support and Resistance levels tend to be.
Quick Reference: How to Read the OI Signal
| Signal | What It Means | Action |
|---|---|---|
| High Put OI at a strike | Strong Support — buyers are positioned here | Look for long entries near this level |
| High Call OI at a strike | Strong Resistance — sellers are positioned here | Look for short entries or exit near this level |
| OI rising + price rising | Trend is bullish and getting stronger | Trend-following longs |
| OI rising + price falling | Bearish momentum building | Trend-following shorts |
Frequently Asked Questions
Q1: Where do I find the NSE Option Chain?
Visit nseindia.com → Derivatives section → Option Chain → Select Nifty, Bank Nifty or any stock.
Q2: What is the most important column for a beginner?
OI (Open Interest). Ignore Volume, LTP and IV when you are starting out. OI alone is enough to identify key Support and Resistance levels.
Q3: Can I use this method for Bank Nifty too?
Yes. The exact same process works for Bank Nifty and individual stocks. Just open the respective Option Chain on NSE and apply the same OI analysis.
Q4: What does it mean if OI changes rapidly during the day?
Rapid OI changes indicate that large traders are shifting positions. A sudden rise in Call OI at a strike during the day signals increased resistance at that level. Track OI changes alongside price movement for the most useful signals.
Try It Now
Open nseindia.com → go to Option Chain → select Nifty → look at the PUT OI column for the highest number (your Support) and the CALL OI column for the highest number (your Resistance). You will have your trading range in under 5 minutes.
Related Finance Guides
- Personal Finance Section — Money management, investing and savings guides
- SIP Calculator — Calculate returns on monthly investments
- CAGR Calculator — Measure compounded annual growth rate
Disclaimer: This article is for educational purposes only and does not constitute financial or investment advice. Options trading involves significant risk. Consult a SEBI-registered advisor before making investment decisions.