Bitcoin Price June 2026: Why BTC Is Stuck at $73K and What Comes Next
What You Will Learn
- Why the June 1 Bitcoin price depended on the time and source used.
- What Farside’s dated ETF flow table says about late-May selling.
- Why IBIT flows and total spot ETF flows answer different questions.
- How to read the phrase “what comes next” without turning market data into a forecast.
Bitcoin Price on June 1, 2026
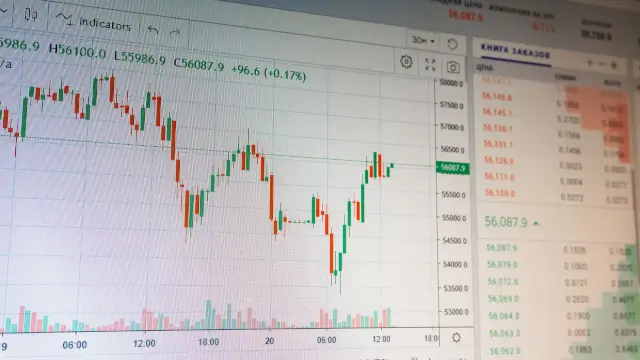
The phrase “Bitcoin stuck at $73K” is a range label, not a single official price. On June 1, 2026, different published snapshots showed Bitcoin moving through a wide intraday range. Yahoo Finance reported an opening price of $73,568.40 and said the price had fallen to $71,400.64 by 9:56 a.m. Eastern Time. Fortune recorded $72,145.11 at 8:45 a.m. Eastern Time.
These figures do not contradict one another automatically. They were captured at different times and can use different market data feeds. Bitcoin trades continuously across venues, and a price can change materially between an opening snapshot and a later intraday reading.
The original article used a rounded opening-area figure. The more precise Yahoo Finance observation is $73,568.40. The revised article keeps the $73K framing because it describes the zone that readers were watching, but it does not present the rounded headline zone as an official closing price or a guaranteed support level.
A dated market report should always answer three questions. What instrument is being measured, which source supplied the price, and at what time was the snapshot taken. Without those details, a number that looks precise can give a false impression of consistency.
| Source and time | Reported Bitcoin price | How to read it |
|---|---|---|
| Yahoo Finance opening snapshot, June 1, 2026 | $73,568.40 | Opening observation for the source’s market feed |
| Fortune, 8:45 a.m. ET, June 1, 2026 | $72,145.11 | Earlier intraday snapshot |
| Yahoo Finance, 9:56 a.m. ET, June 1, 2026 | $71,400.64 | Later intraday snapshot after the reported decline |
| Headline range | $73K | Rounded zone used for reader orientation, not a fixed close |
The Yahoo Finance June 1 report and the Fortune June 1 snapshot should be cited with their times. Neither source supports a price prediction for the rest of June.
Why the $73K Label Can Mislead
Market headlines often compress a moving price into a round number. That helps a reader understand the general zone, but it can hide the difference between an opening price, a last trade, a high, a low, and a reference rate. The difference is important when a market moves rapidly.
Bitcoin also has no single central exchange that determines every trade. A price feed can aggregate venues, use a particular benchmark, or reflect a specific exchange. Two reputable reports can therefore show different prices at close times without either being fabricated.
The June 1 snapshots show why a support argument needs a time window. Bitcoin was reported at $73,568.40 at the Yahoo opening and at $71,400.64 by 9:56 a.m. ET. Fortune’s $72,145.11 observation fell between those reported levels in time but came from a separate data page.
The correct conclusion is descriptive. Bitcoin was volatile and under pressure during the morning covered by the reports. The data do not establish that the market had chosen a permanent floor at $73,000 or that a particular technical level would hold.
Readers should be cautious with phrases such as “the battle at support” or “the next leg.” Those phrases can describe the question traders were asking, but they do not answer it. An article can explain the evidence without presenting a chart level as a promise.
Late-May Spot ETF Outflows
Farside Investors’ all-data table reports daily Bitcoin ETF flows in U.S. dollar millions. Negative values represent net outflows. The table shows that the U.S. spot Bitcoin ETF complex lost $648.6 million on May 18, $331.1 million on May 19, $70.5 million on May 20, $100.9 million on May 21, and $105.2 million on May 22, 2026.
Adding those daily totals gives $1,256.3 million of outflows from May 18 to May 22. That is the source basis for the rounded $1.26 billion weekly figure used in the old article. The same Farside rows show IBIT outflows of $1,008.1 million over that period, which rounds to $1.01 billion.
The calculation is useful because it shows the measurement window. It is not a statement that a single investor sold $1.01 billion or that BlackRock itself sold Bitcoin. Farside’s IBIT column records the fund’s flow result, not the identity of the account submitting each order.
| Date | IBIT flow, US$ millions | Total U.S. spot ETF flow, US$ millions |
|---|---|---|
| May 18, 2026 | (448.4) | (648.6) |
| May 19, 2026 | (325.6) | (331.1) |
| May 20, 2026 | (61.5) | (70.5) |
| May 21, 2026 | (103.7) | (100.9) |
| May 22, 2026 | (68.9) | (105.2) |
| May 18 to May 22 total | (1,008.1) | (1,256.3) |
The Farside Bitcoin ETF flow table is the primary table for these calculations. The values are in US$ millions and negative values indicate outflows. They should not be confused with Bitcoin units or with the gross value of secondary-market share trading.
June 1 ETF Flow Shock
Farside’s June 1 row shows $483.8 million of net outflows from the U.S. spot Bitcoin ETF group. IBIT accounted for $440.3 million of that day’s outflow in the table. Those two figures provide a dated explanation for why ETF selling was part of the June 1 market conversation.
The figures still require careful wording. A net outflow is the result after creations and redemptions are offset. It does not mean that every investor sold shares, and it does not mean that the same amount of Bitcoin was sold immediately on a public exchange.
IBIT’s share of the daily total was large on June 1, but that observation does not prove that IBIT caused the entire Bitcoin price move. Price changes can reflect spot trading, derivatives, macro news, liquidations, currency movements, and other forces that are not isolated by a single ETF flow table.
The original article described the outflow stretch as the heaviest five-day period of 2026. Farside’s dated rows support the dollar total for May 18 to May 22, but a claim that it was the heaviest period requires a full-year comparison. The revised article keeps the arithmetic and removes the unsupported ranking language.
IBIT Flows Versus Total ETF Flows
IBIT is one fund inside the U.S. spot Bitcoin ETF group. Its flow can be large without representing the whole complex, and the total complex can move differently from IBIT on another day. The distinction matters when a headline attributes a market move to one issuer.
On May 26, Farside reported IBIT outflows of $192.4 million and total group outflows of $333.6 million. On May 27, the table showed IBIT outflows of $527.8 million and total group outflows of $733.4 million. On June 1, it showed IBIT outflows of $440.3 million and total group outflows of $483.8 million.
These values are close to the rounded numbers reported by CoinDesk, including $192 million, $334 million, $527.84 million, and $733.43 million. Farside displays flows in US$ millions with one decimal place, while media reports may use different rounding. The source and precision should be made clear rather than mixing them in one calculation.
| Date | IBIT outflow | Total U.S. spot Bitcoin ETF outflow |
|---|---|---|
| May 26, 2026 | $192.4 million | $333.6 million |
| May 27, 2026 | $527.8 million | $733.4 million |
| June 1, 2026 | $440.3 million | $483.8 million |
Comparing these rows helps separate fund concentration from market-wide activity. IBIT was the largest contributor on each listed date, but the table does not show whether its shareholders moved to another Bitcoin ETF, reduced exposure, or changed risk through a different product.
What ETF Flows Can Tell You
ETF flows are useful because they show how much net capital entered or left a fund or fund group during a defined period. They can help readers track demand for a listed product, but they are not a complete sentiment survey and do not identify each investor’s reason for trading.
A fund can record an outflow while its shares remain actively traded. An investor can sell shares to another investor on the secondary market without a matching redemption from the trust. A net redemption occurs when the creation and redemption process produces more withdrawals than creations.
The flow table also does not equal the fund’s daily trading volume. Trading volume measures shares changing hands in the market. Flow measures the net balance of creations and redemptions. Assets under management can change because of Bitcoin’s price as well as new money entering or leaving.
For a clean interpretation, read flows with the price timestamp, the fund’s NAV, the market price, and the data provider’s definitions. If the article does not state those boundaries, a precise number can be used to imply more certainty than it deserves.
What the Technical Level Question Really Means
The $73K level in the protected title is best treated as a reference zone that traders were watching. A support level is not a guarantee. It is a price area where previous buying interest, positioning, or order activity may appear. The level can fail, move, or become resistance.
The June 1 data do not provide enough evidence to forecast whether Bitcoin would reclaim a higher level or fall to a lower target. The old article’s specific price targets are therefore removed because they were not anchored to a verified technical study in the reviewed source set.
A better technical reading asks what would confirm or weaken a price thesis. A trader may compare multiple time frames, spot volume, futures positioning, volatility, and the relationship between market price and ETF flows. This is an analytical process, not a result that can be inferred from one morning’s price snapshot.
The article’s conclusion stays with what is observable. Bitcoin moved through the reported June 1 prices while ETF flows were negative. The data justify monitoring the range and the flows, but not promising which direction comes next.
Macro and Policy Claims Need Their Own Sources
The old article linked the Bitcoin range to exchange reserves, futures open interest, the CLARITY Act, and a Federal Reserve meeting. Those topics can influence the market, but each requires its own dated source and definition. They should not be inserted as supporting facts merely because they sound plausible.
Exchange reserves require a stated set of platforms, a measurement method, and a timestamp. Futures open interest requires a stated venue or aggregation source and a distinction between notional value and contracts. Legislative claims require the bill version and legislative stage. Interest-rate probabilities require a dated market-implied measure and should not be presented as a central-bank decision.
The revised article does not repeat the unverified exchange-reserve, futures-open-interest, legislative, or interest-rate-probability claims. Removing them is not a judgment that they were impossible. It is a recognition that they were not supported by the source set used here.
This source discipline matters more when a market is moving. A list of plausible catalysts can create a convincing story even when the figures refer to different times or data populations. The reader should see which observation is confirmed and which question remains open.
What Comes Next Without a Price Forecast
“What comes next” can be answered with a monitoring plan rather than a target. The first item is whether the next Farside rows show continued outflows or a reversal. The second is whether IBIT’s flow differs from the rest of the U.S. spot ETF group. The third is whether Bitcoin’s price remains in the same range after the selling data are published.
The fourth item is the data timestamp. A later price report may show a different result from the June 1 morning snapshots. A later flow report may revise a preliminary figure or add a new trading day. A later BlackRock product snapshot may show a different asset balance, NAV, closing price, or shares outstanding.
This approach does not make the article less useful. It tells readers what evidence would change the assessment and avoids treating one outcome as inevitable. It also reduces the risk of confusing a daily market observation with an investment recommendation.
Readers should treat any future target as a scenario from the source that publishes it. A target is not a fact about where Bitcoin must trade. A flow reversal is not proof of a new bull market. A continued outflow is not proof that every investor has abandoned the asset.
BlackRock IBIT Data and Risk Context
BlackRock’s iShares product page identifies IBIT as the iShares Bitcoin Trust ETF and says it seeks to reflect the performance of Bitcoin. The page showed NAV of $43.66 as of August 21, 2026, net assets of $58,775,215,765 as of August 21, closing price of $41.20 as of August 20, daily volume of 108,151,790 shares as of August 20, shares outstanding of 1,346,080,000 as of August 21, and a sponsor fee of 0.25 percent.
These are later August snapshots, not June 1 trade-day figures. They are included to show why the date label matters when discussing an ETF. A later asset figure cannot be used to reconstruct the value of an earlier trade without a dated price and an explanation of the calculation.
BlackRock’s product material also explains that IBIT shares trade on the secondary market and are not individually redeemable from the trust. Only authorized participants can purchase or redeem large aggregated baskets. That structure is why a share trade, a fund redemption, and a change in assets are related but distinct events. The iShares Bitcoin Trust product page is the primary source for the fund’s structure and risk disclosures.
The fund page warns that digital assets are volatile, shares can trade above or below NAV, and investors can lose principal. The article does not recommend buying or selling Bitcoin or IBIT. It presents the dated price and flow evidence for readers who want to understand the market report.
What the Old Article Got Wrong
The old article treated a June 1 price snapshot as if it were a fixed market level and described $1.26 billion of ETF outflows without showing the source window. It also stated that BlackRock alone was responsible for about $1.01 billion without making clear that the number was a rounded five-day IBIT flow calculation.
The revised body shows the Farside rows and the sums. It identifies negative values as outflows, keeps the data in US$ millions, and separates IBIT from the total U.S. spot Bitcoin ETF group. It also replaces unsupported price targets with a monitoring plan.
The old version included exchange reserve, futures open-interest, legislative, and interest-rate probability claims that were not verified for this rewrite. Those claims are removed rather than presented as background facts. The revised article also avoids describing ETF flows as proof of panic, capitulation, or a guaranteed trend.
The central conclusion is narrower and more defensible. Bitcoin was volatile on the June 1 morning covered by the published snapshots, and Farside recorded significant ETF outflows. Those observations explain the market pressure without proving why every investor acted or where the price will go next.
Related context is available in the Current Affair Finance section, the Bitcoin ETF inflow article, and the Tesla SpaceX Bitcoin scenario article. Publisher context is available from the Current Affair home page and the site information page. These internal references provide context and do not turn the June 1 observations into a forecast.
Bottom Line on Bitcoin Price June 2026
On June 1, 2026, Yahoo Finance reported Bitcoin at an opening price of $73,568.40 and at $71,400.64 by 9:56 a.m. ET. Fortune reported $72,145.11 at 8:45 a.m. ET. The snapshots show intraday weakness, but their different timestamps mean they should not be treated as one official price.
Farside recorded $483.8 million of total U.S. spot Bitcoin ETF outflows and $440.3 million of IBIT outflows on June 1. It also shows $1,256.3 million of total outflows and $1,008.1 million of IBIT outflows from May 18 to May 22. Those figures describe dated flow results, not the identity or motive of each seller.
The best answer to what comes next is to watch new price snapshots, new Farside rows, IBIT’s position against the wider ETF group, and whether the range persists after the flow data change. Until those observations arrive, $73K is a headline zone, not a promise of support, and the market direction remains unverified.
Frequently Asked Questions

SK Jabedul Haque
Building India's most trusted finance education platform — simplifying news, schemes and market trends so anyone can understand and invest confidently.
Read full bio


Never miss an update
Get our clearest explainers on schemes, markets and money — read what matters, without the noise.
Explore more articles